Complex Graphs
Advertisement

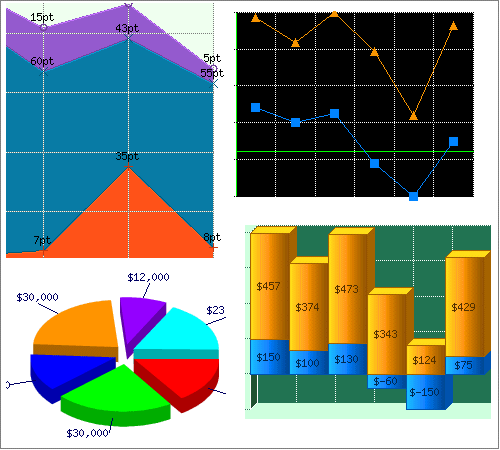
Make Professional looking graphs with Java 3d Graph Software v.9.0
With 1-2-3 PieCharts you can now quickly and easily create professional looking 3d graphs without any of the usual hassle.

Schedule Complex Shifts for Your Employees
The Complex-25 Excel spreadsheet creates schedules where each employee can be assigned to a category (manager, cook, etc.), a location (Store A, Store B, etc.) and a time (10:30 AM - 4:30 PM) each day for up to 4 weeks. The spreadsheet can enforce
X3 Factory Complex Calculator v.2.0.0.2
Using the X3 Factory Complex Calculator tool will help you calculate the costs, profits and energy required for your own factory complexes for use in the X3 Reunion space trading and combat simulation game by Egosoft.
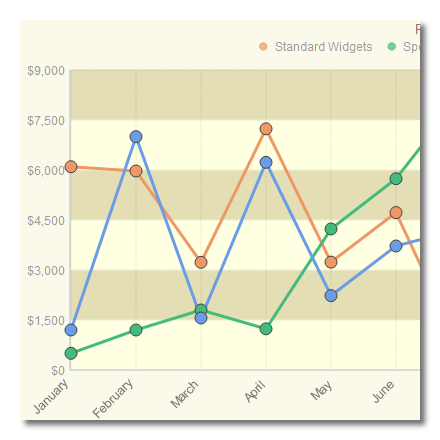
Graphs Made Easy v.3 1
Graphs Made Easy (GME) is an easy way to make great looking graphs in minutes. The traditional approach of spreadsheets and data grids is replaced with simplified data entry. Graphs Made Easy Basic is freeware.

Complex Shift Schedules for 25 People v.6 3
The Complex-25 Excel spreadsheet creates schedules where each employee is assigned to a category (manager, cook, etc.), a location (Store A, Store B, etc.) and a time (10:30 AM - 4:30 PM) each day for up to a month.
Complex Function Plot v.1.0
Plot complex function of position and time with the help of this tool. Complex Function Plot software displays a user-defined complex function of position and time using representations that map phase into color.
Infowise Graphs v.1.0.7
Analyze your list data as simple and visually appealing graphs and charts. Infowise Graphs enables users to create a graphic interface to SharePoint lists, and in the current version contains two web parts with the following abilities: 1. Pie Chart:

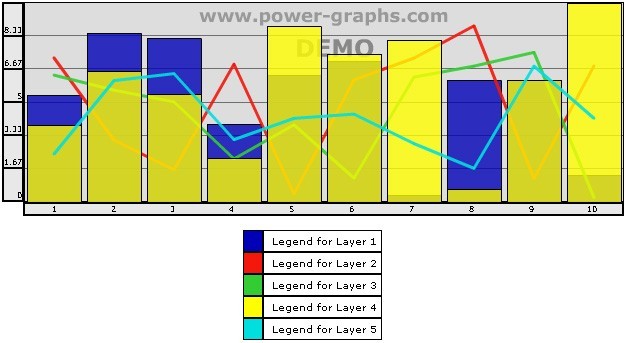
Advanced Dynamic Graphs and Charts PHP v.6.3
Add Powerful reporting features to your Web / Intranet pages and applications.

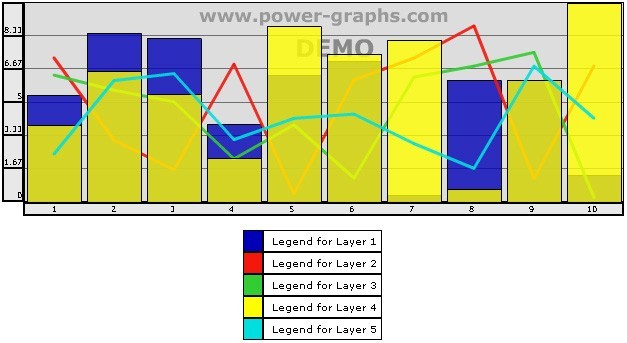
Active Graphs and Charts v.2.1
Add Powerful reporting features to your Web / Intranet pages and applications.

